2026 Church Giving Trends: How the Economy Will Impact Religious Giving
The financial health of the faith community is deeply tied to the world we navigate every day, including the economic and political trends that impact our daily lives.
From the record-breaking 43-day federal government shutdown to rising costs and tariffs, 2025 was a year of deep uncertainty. Yet, through it all, faith-based and church giving remained remarkably resilient.
As we look toward 2026, we’ll reflect on how church giving evolved in 2025 and explore how new tax laws and economic trends might shape generosity in the year ahead.
Reflecting on 2025: Economic events and church giving trends
While we saw some signs of economic stability in 2025, such as steadying inflation, there was also plenty of economic news that kept uncertainty at the forefront.
Labor markets slowed
In the job market, we saw cuts in the public sector and a general slowdown in payroll growth, along with the lingering question of whether AI might start replacing certain jobs.
Tariffs led to higher prices
Then there were broad tariffs that started in April, which led to higher prices at the grocery store and for everyday household goods. Thankfully, though, the short-term impact was not quite as bad as some had feared.
Government shutdown strained households
Then came October 1, when the 43-day federal government shutdown began — the longest in U.S. history. The shutdown lasted until mid-November when a temporary funding deal was reached.
This was not just a political headline. The 2025 shutdown directly affected about 1.4 million federal workers, who were either sent home or forced to work without pay.
It impacted air travel and hit the most vulnerable among us the hardest. Families who rely on SNAP (often referred to as “food stamps”) and the WIC program for nutrition suddenly found themselves without those benefits.
This put an immediate strain on households across the country. Many faith communities and nonprofits jumped into action, providing food and support even as they navigated their own challenges.
Inflation held steady
On the bright side, the inflation rate held steady at around 3% in 2025, which is where it was in 2024. That was a drastic improvement from the 9% peak we saw back in mid-2022.
How these economic trends impacted charitable and religious giving in 2025
Amid all this uncertainty, we saw some interesting trends emerging in charitable and religious giving in 2025.
Average donation amount grew more slowly during the shutdown
The government shutdown had a noticeable impact on faith-based and church giving. Average donations were lower than expected during the shutdown (October-December 2025) compared to earlier in the year (January-September 2025).
From January through September, the average donation increased by $2 compared to the same period in 2024. During the government shutdown, the average gift increase was only $1.10.
This means that had trends in early 2025 continued into the period of the shutdown, we would have expected average donations to be about $2 higher than the previous year. Instead, they went up by half of that. This represents a loss of $0.90 per donation during the last quarter of 2025 (Figure 1).
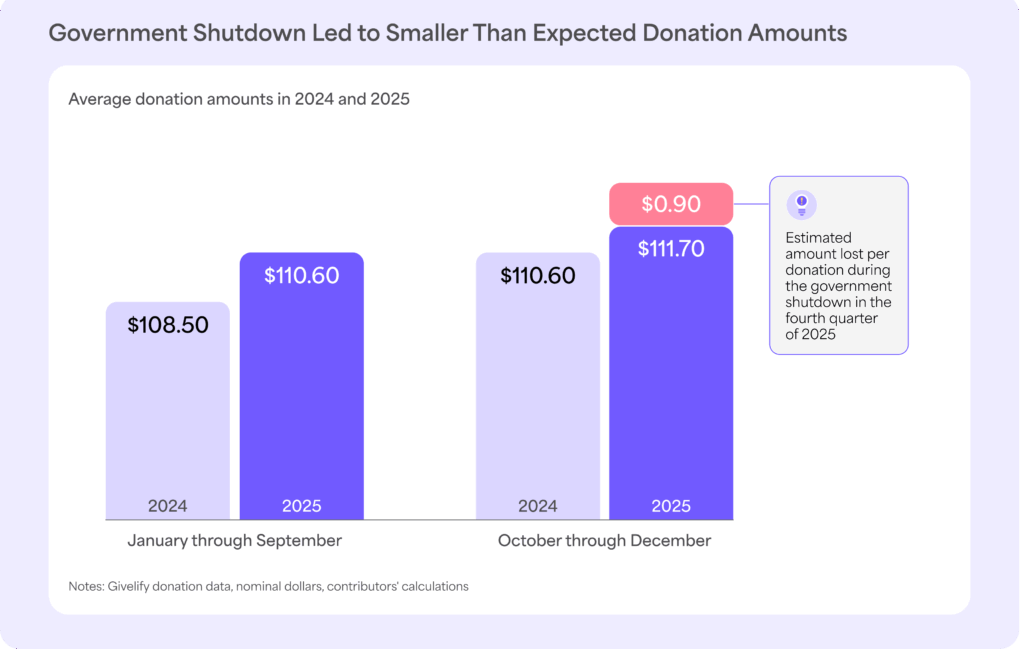
Figure 1: Effect of government shutdown on giving
More people gave, but their donations were smaller
Despite ongoing uncertainty, charitable giving has been persistent. Overall, giving has been trending upward for several years. In 2024, GivingUSA estimated that total giving (adjusted for inflation) increased by 3.3%. While giving to religious organizations dipped by 1%, other sectors, like education and human services, saw modest growth.
Interestingly, a weekly survey by GivingTuesday (GivingPulse) showed a unique shift in 2025: The percentage of people who reported giving in the previous seven days rose from 21% to 24% — a 3-percentage-point jump.
At the same time, the average amount people gave (after adjusting for inflation) dropped by 9.2%, moving from $228 down to $207. In other words, more people are stepping up to help, but because of the tight economy, they are giving in smaller increments.
How church giving trends have changed over time
When we look more closely at church giving trends over the last few years, a few patterns stand out.
Average donation size grew, but not enough to outpace inflation
Since 2023, average donations have increased by about $2 each year. This is a rise of roughly 2% per year (Figure 2a). To put that into context, total inflation since January 2023 is around 8%.
This means that while people are giving larger dollar amounts, those donations are not keeping up with the rising cost of living. This reflects a broader trend in spending where people are adjusting their giving due to higher costs and lower disposable income.
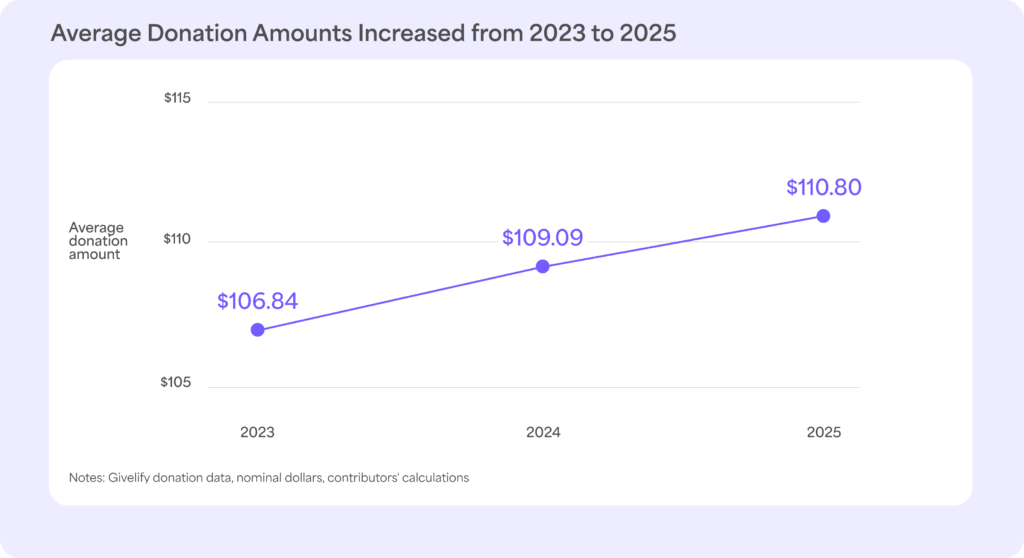
Figure 2a: Average faith-based gift amounts in 2023, 2024, and 2025
Tithe giving is more resilient to economic changes
Giving in faith communities is typically divided between tithes and donations for other purposes, with the split being about half and half. For people who make tithe gifts, the patterns of tithe gifts and non-tithe gifts are quite different.
Average tithe gifts have risen by about $5 each year, or roughly 3% (the average gift was about $157 in 2023, $162 in 2024, and $166 in 2025), but non-tithe gifts hardly increased at all ($47 in 2023, $48 in 2024, and $48 in 2025) (Figure 2b).
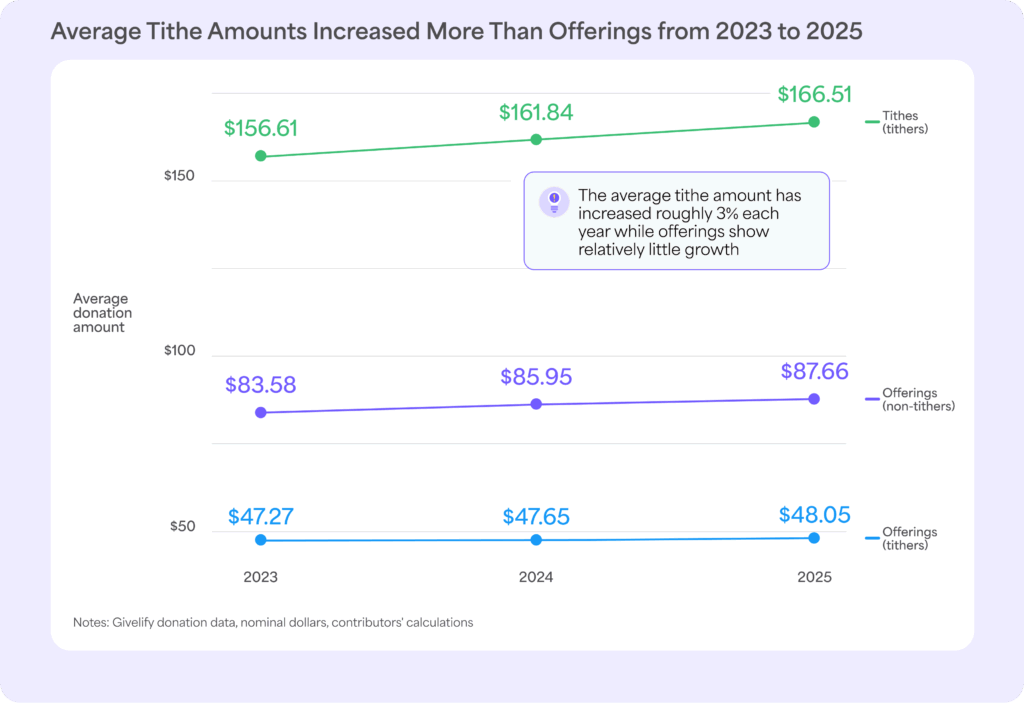
Figure 2b: Average faith-based tithe and non-tithe gift amounts in 2023, 2024, and 2025
This suggests that tithe giving is much more resilient than other forms of giving. Tithers appear to adjust their non-tithe giving in response to economic conditions, but their tithe gifts increase every year. Currently, these tithe gifts are increasing at a rate similar to the rate at which prices are rising in the economy.
Looking forward to 2026: Economic trends and tax code changes
Many of the economic trends we saw in 2025 are expected to continue into 2026, which will likely influence how people give.
Inflation will remain steady
Inflation has settled at 3% since its peak in 2022, but it is unlikely to drop to the Federal Reserve’s target of 2%. This means affordability will remain a challenge in the coming year, and many families will likely have about the same amount of disposable income as they do now.
Government shutdowns and elections may impact giving
We also face the possibility of additional government shutdowns. As of January 31, 2026, the government entered a partial shutdown. While a deal was reached four days later to ensure federal funding through the end of September, it excludes DHS funding, which is set to expire on February 13, 2026.
On top of that, the midterm elections in November could shift the balance of power in Congress and the Senate, potentially altering economic policies.
In short, the same mix of uncertainty and stability that households navigated in 2025 will likely persist through 2026, continuing to affect faith-based and church giving.
New tax code changes will benefit donors
A major change to the income tax code in 2026 will have significant implications for donors. When filing their taxes, donors can take either a standard or an itemized deduction.
A standard deduction is a fixed amount set by the IRS, whereas an itemized deduction is a sum of eligible expenses that vary by taxpayer. Both deductions reduce taxable income.
For the last 40 years, the only way to receive a tax deduction for charitable giving was to itemize deductions on a tax return. This deduction reduces taxable income, effectively lowering the cost of donating by eliminating the taxes that would have been paid on that money.
While this is meant to encourage giving, only a minority of people itemize. Currently, 90% of tax filers take the standard deduction, which makes them ineligible for these tax savings.
Deductions continue for those choosing an itemized deduction
In 2026, the rules for who is eligible for this deduction will change. Those who itemize can still deduct their contributions, though with some modifications: They cannot deduct the first 0.5% of their Adjusted Gross Income (AGI), but any donations above that threshold can be deducted up to 60% of their AGI.
New charitable tax deduction for those who choose a standard deduction
The new development applies to those who choose the standard deduction. These taxpayers will now be allowed to deduct a portion of their charitable contributions from their taxable income. This limit is $1,000 for single filers and $2,000 for joint filers. This shift could have a major impact on church giving.
How the 2026 tax code change could impact church giving
For 90% of the population, this change means they will get more money back when they file their taxes. For example, if someone makes a $100 donation (and they are in a 22% marginal tax bracket), they would see an additional $22 in their tax refund. That is money that could potentially be given to their church.
We can see how this looks across different tax brackets for joint filers using the standard deduction (Figure 3). For example, for households with taxable income between $24,801 and $100,800, the average donation in 2025 was $2,346. If they give that same amount in 2026, they will get an additional $240 back in their 2026 tax refund.
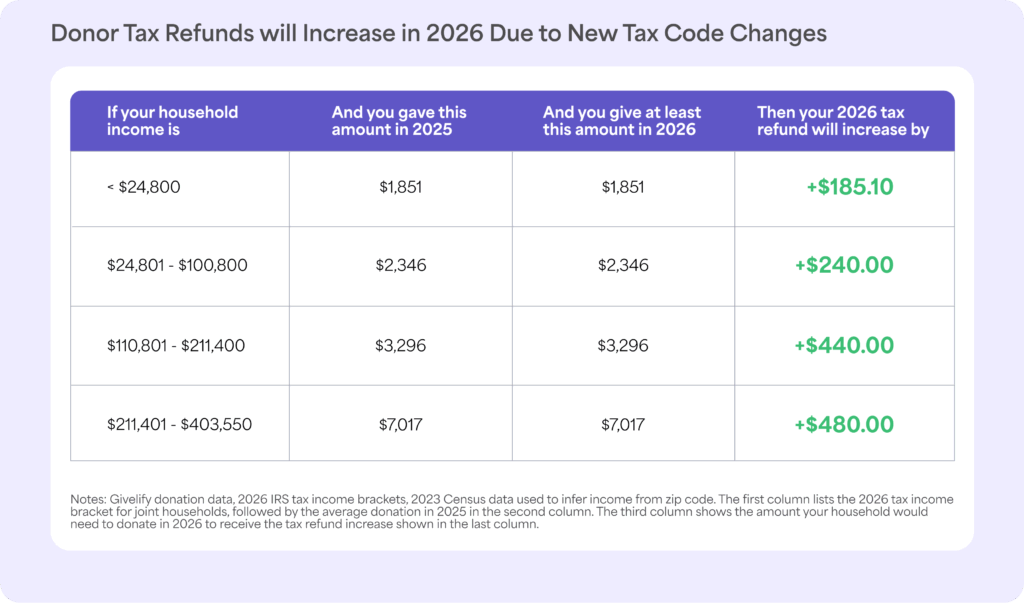
Figure 3: Potential 2026 tax refund increase based on 2025 average donation amounts per household
With these higher refunds, a donor could choose to give more in 2026 and still spend the same out of pocket amount as they did in 2025. For example, the donor who gave $100 in 2025 and is in a 22% tax bracket could give $128 in 2026. They would get roughly $28 more back in their tax refund. They would effectively have paid the same $100 out of pocket (their 2026 donation minus their refund).
While our examples focus on joint filers taking the standard deduction (capped at $2,000), the savings for those who itemize could be even larger, as their deductions are capped at 60% of their AGI. The examples are meant for illustration, as actual tax savings will depend on each person’s unique financial situation and giving habits.
Resiliency in religious giving
It’s encouraging to see how steady our communities have stayed. Tithing continues to be a resilient foundation, even when the broader economy feels uncertain.
As we move into 2026, faith-based organizations will face a mix of familiar challenges and new opportunities. We expect the economic climate to look a lot like it did in 2025. Inflation should stay relatively low, but the cost of living will likely remain a concern for many families.
The expansion of the tax deduction for charitable giving provides a unique chance for donors to further support your mission. Since this tax benefit now applies to every tax filer, it offers a practical way to encourage and grow the spirit of generosity within your community.
Contributors
Ragan Petrie, PhD, Economist, Texas A&M University
Ragan is an economist who uses behavioral and experimental approaches to study motives for charitable giving, gender differences in bargaining and competition, discrimination, social media and the economic preferences of children. She is a Professor of Economics at Texas A&M University.
Marco Castillo, PhD, Economist, Texas A&M University
Marco is an economist who uses experimental methods to identify optimal policy design and interventions in areas ranging from crime, human capital accumulation, to charitable fundraising. He is a Professor of Economics at Texas A&M University.
AJ Mafolasire, M.D., Head of Data Science & Philanthropic Research, Givelify
AJ is a data scientist with nearly two decades of data science and research experience who leads the vision and strategy for advanced analytics tools and systems at Givelify. He holds a Doctor of Medicine degree from Yale University School of Medicine and earned a Master’s in Mechanical Engineering from Purdue University, as well as a Master of Health Science from Yale University School of Medicine.
Tiffani Ng, PhD, Philanthropic Research Scientist, Givelify
Tiffani is a research scientist who leverages experimental and data-driven approaches to better understand how and why people give to faith-based and nonprofit organizations and causes. She holds both a Doctor of Philosophy and a Master of Science degree in psychology with a concentration in brain, behavior, and cognition from Northwestern University.
About the Author