The 2015 M+R Benchmarks Report for Nonprofits Is Here
The 2015 M+R Benchmarks Report was released this week, and nonprofit leaders and staff are surely engrossed in its findings. Produced yearly in conjunction with NTEN, the report collects data about email messaging, fundraising, online advocacy, web traffic, social media and mobile programs from 84 nonprofits of various sizes and sectors.
The report provides key metrics against which you can examine your own nonprofit group’s activity, as well as valuable insights that can help your fundraising efforts.
You can download the entire report for free and get more in-depth data and analysis. Following are some of the key findings and our interpretations.
Some Key Findings
Online revenue increased by 13% from 2013 to 2014
Groups raised $612 for every 1,000 website visitors
Online monthly giving grew by 31%
The average online one-time gift was $104
The average online monthly gift was $23
On average 13% of visitors to an organization’s main donation page completed a gift
Social Media
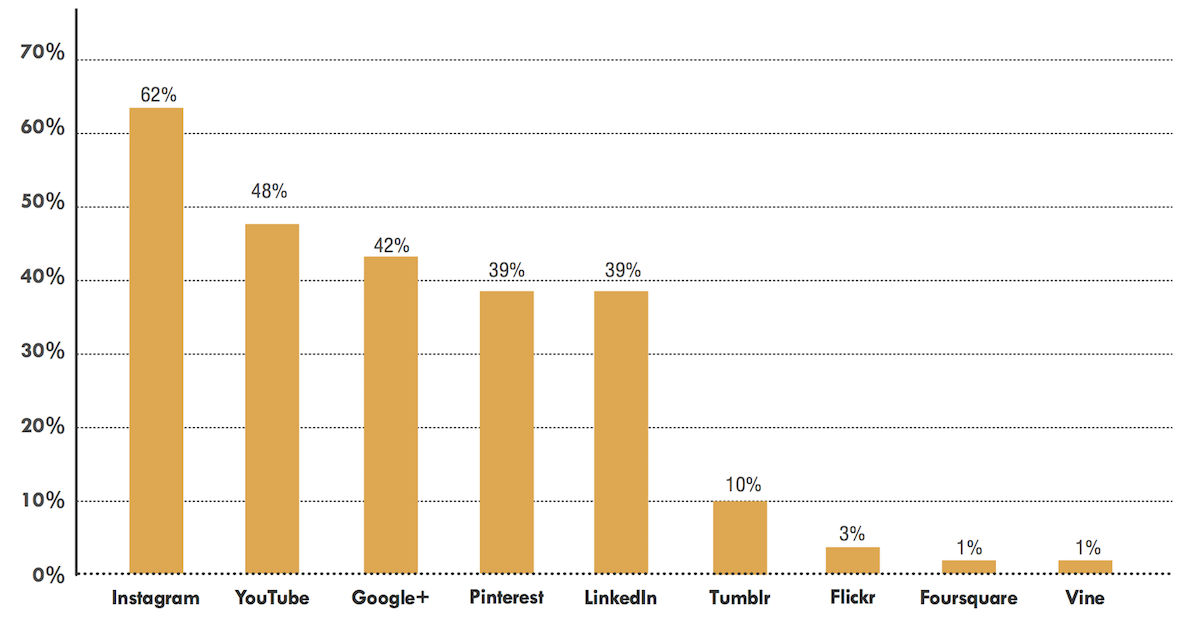
Outside of Facebook and Twitter, participants were asked what three other online channels were most important. For anyone reasonably well-versed on social media, the top results are hardly surprising: Instagram (62%), YouTube (48%), Google+ (42%), Pinterest (39%), and LinkedIn (39%).
Click to enlarge (courtesy M+R & NTEN)
The demographics of Instagram and Pinterest tend to skew younger than, say, LinkedIn. This shows that nonprofits are doing their homework, targeting younger donors using the channels those users prefer. Meeting your donors where they are and fostering younger givers is critical to your organization’s long-term success.
Additionally, the change in number of Facebook fans averaged 42% and Twitter 37%. People are clearly interested in following and interacting with causes on social media. They want to hear your message, and they want to help. Engaging with your fans and followers is key to driving them to donate.
Website Donations
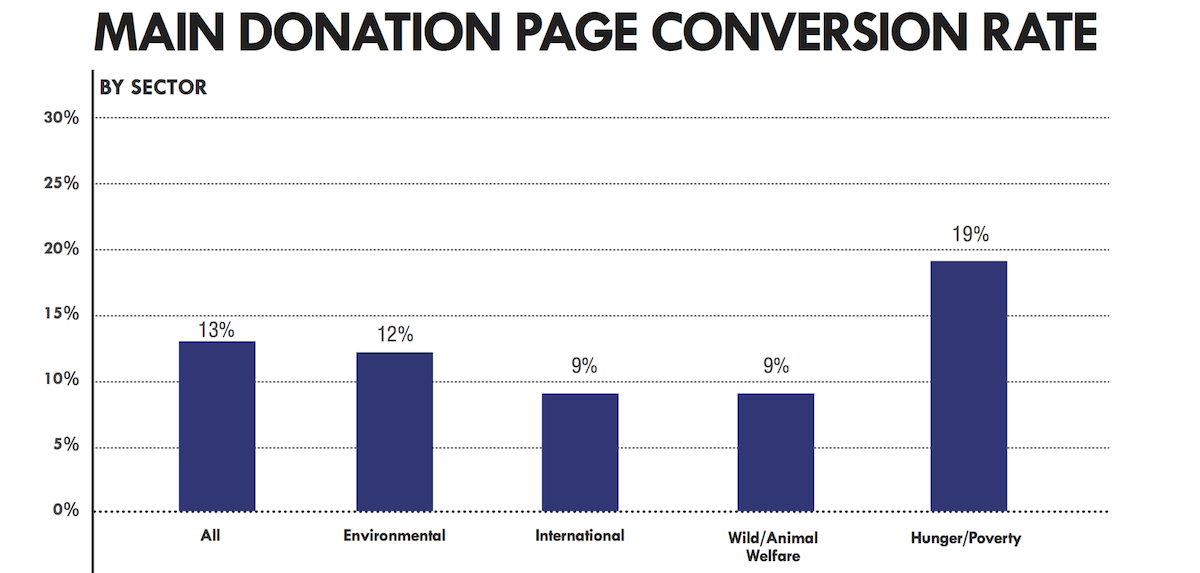
The average website donation conversion rate across all sectors was 0.8%, meaning that fewer than one in 100 website visitors became donors. In contrast, the average conversion rate of organizations’ main donation page was 13%.
Click to enlarge (courtesy M+R & NTEN)
What does this mean? Targeted landing and donation pages are the way to go. When linking to your website from social media with the goal of spurring donations, you have to do better than just linking to the main page and calling it a day. Linking directly to your donation page (if you only have one) or a campaign-specific landing page with a donation call-to-action gives you a 113% better chance at turning those visitors into donors.
Read the Report
Download the 2015 M+R Benchmarks Report for free.
Want To Participate?
If your nonprofit tracks the relevant metrics, you can sign up to take part in this year’s study.
About the Author